Results
Movement Data
After data cleaning and removing locations with missing information and / or high elevational error, the final data set retained 92,274 locations. Subsetting the data by threshold distance, date, and time of day showed noticeable differences in 'turn' angle only at <125 m when locations occurred between May 1 - August 15, between 7 am and 7 pm (MA77_u125). The difference in mean turn angle quickly degraded from 1.72 at <125, to 1.62 at <250 with no observable difference by 500 m (Figure 4.A). To further evaluate the relationship between lick sites and movement, the "training" data set was compared for both (Figure 4.B) 'turn' angle and (Figure 4.C) step length of animals arriving at the lick sites ('dist').
After data cleaning and removing locations with missing information and / or high elevational error, the final data set retained 92,274 locations. Subsetting the data by threshold distance, date, and time of day showed noticeable differences in 'turn' angle only at <125 m when locations occurred between May 1 - August 15, between 7 am and 7 pm (MA77_u125). The difference in mean turn angle quickly degraded from 1.72 at <125, to 1.62 at <250 with no observable difference by 500 m (Figure 4.A). To further evaluate the relationship between lick sites and movement, the "training" data set was compared for both (Figure 4.B) 'turn' angle and (Figure 4.C) step length of animals arriving at the lick sites ('dist').

Figure 3. Comparison of all bighorn sheep locations (n = 92,274) under ('u') and over ('g') 125, 250, 500 and 1000 m threshold distances, and various time periods (MA = May 1 - August 15; 77 = 7:00 am to 7:00 pm) for (A) all "known" BISH mineral lick locations, (B) mean turning angle for "training" lick site locations ('t') and all others, and (C) mean step length (dist) into the "training" lick sites and all other locations.
The results of the Random Forest analysis resulted in predicted probability values being assigned to each animal location (Figure 5.). Most locations were assigned a value of <0.002, 2,496 locations >0.002 and <0.149. While 106 locations had values >0.149, 88 locations were directly associated with the four training sites, corresponding with the four red dots in the lower portion of the map. Ten new locations were predicted with values 0.149-0.230, and eight new locations values 0.231-0.496. Results from running the trained model with only data from the same time period, and incorporating age and group were not noticeably different than using all data.
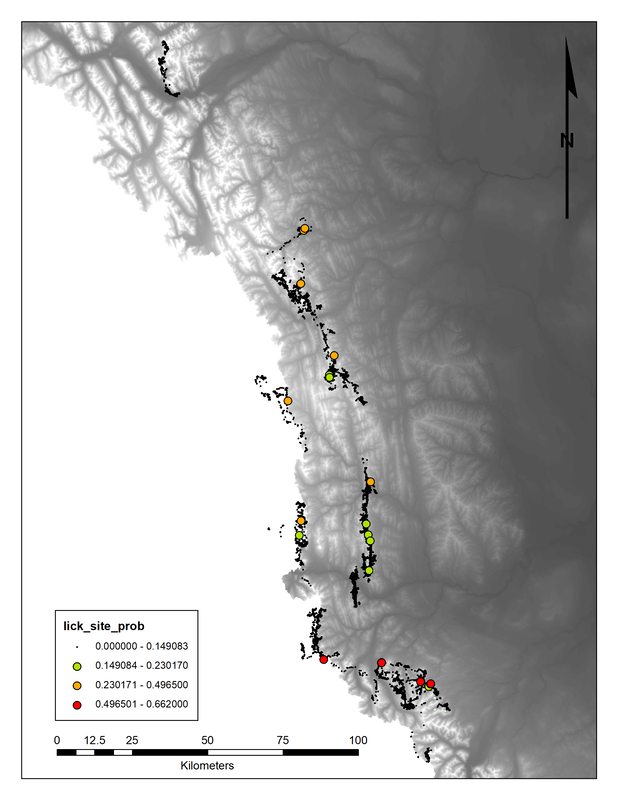
Figure 5. Map of bighorn sheep locations with Random Forest (500 trees) predicted values showing probability of association with mineral lick sites. The four visible red dots are directly associated with known bighorn sheep lick sites used to train the model.
